Setting up Debugging
This guide will show you how to enable advanced tools to make it easier to diagnose errors in your mods.
You should at least be somewhat familiar with modding for this tutorial. It is assumed that you have a development environment set up with both a Debug and a Release configuration, know basic C#, and have developed your first mod.
Note
The contents of this guide are not specific to Subnautica and will work for any Unity game as long as a version of BepInEx that uses Unity Doorstop 4 is installed (v5.4.23.2+).
Features and Limitations
Using debug information generated during build, you can:
- Get exact line numbers in exceptions that show up in the log file.
- Attach a debugger to the game.
- Use standard debugging features like breakpoints, executing code one line at a time, and watching what's happening in your variables.
However, you cannot:
- Use the above features for code for which you do not have a .pdb file, i.e. any code you did not write yourself.
- In particular, you cannot use this to debug code that is part of Subnautica.
Generating Debug Symbols
The first step is to make your IDE generate debugging information while it builds your mod. We will do this only for the Debug configuration, so that you can use Debug for your own testing and Release for sharing your finished mod with others.
Depending on your IDE the settings will be located in different places.
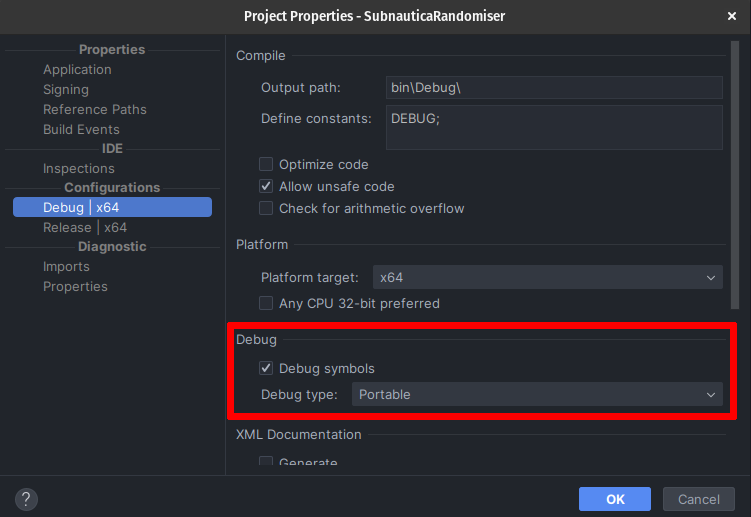
- In the file explorer window on the left, right-click on your project and choose
Properties... - At the top of this new popup window, select the
Debugconfiguration from the dropdown. - On the left, navigate to the
Buildsubmenu. - Set the
Debug Symbolsdropdown toPortable.
Your IDE now generates a {projectname}.pdb file on every build. This file contains all the debug information about your project. Place this file next to your mod's .dll in the BepInEx/plugins directory so that debugging tools can read it. It is important that whenever you build a new version of your mod you also remember to update the .pdb file. Otherwise, the debug information will not line up with your actual code and the debugger will get confused.
Tip
To ensure your files are always in sync, use MSBuild's post-build actions to automatically deploy both the .dll and the .pdb to your game folder.
Enabling the Debugging Server
Since version 5.4.23.2, BepInEx ships with Unity Doorstop 4, which provides a built-in debugging server. Navigate to
your Subnautica install directory (the same place as Subnautica.exe), where you should find a file called doorstop_config.ini. If you do not have this
file, ensure you have the correct version of BepInEx installed.
In doorstop_config.ini, do the following:
- Set
debug_enabledtotrue. - Take note of the address in
debug_addressfor later. - Optionally, set
debug_suspendto true. This will force the game to freeze until you attach a debugger. This is useful if you need to debug code that executes very early on, before the game even loads into the main menu. If unsure, leave this off.
With the debugging server enabled and the information from your .pdb files in the right place, any exceptions that happen in your mod will now display the correct line numbers, regardless of whether a debugger is attached.
Connecting a Debugger to the Debugging Server
Using Visual Studio's built-in Debugger
Visual Studio does not provide support for Unity out of the box. We first need to make sure you have the correct plugin installed to enable Unity debugging.
- Follow the instructions on Microsoft's help page
to install the
Game Development with Unityworkload.- You do not need to install Unity itself or the Unity Hub, just the VS workload is enough.
- To make sure you won't have to repeat the following steps every time you want to debug, ensure that in the options
menu found via the menu bar under
Tools > Options > Tools for Unity > Generalthe settingUse saved debug targetsis set totrue. - In the menu bar at the top of the screen, select
Debug > Attach Unity Debugger. - In the new window that pops up, click
Input IP. - Enter the address you noted down earlier from the doorstep config. By default, the hostname will be 127.0.0.1 and the port 10000.
- Save the connection.
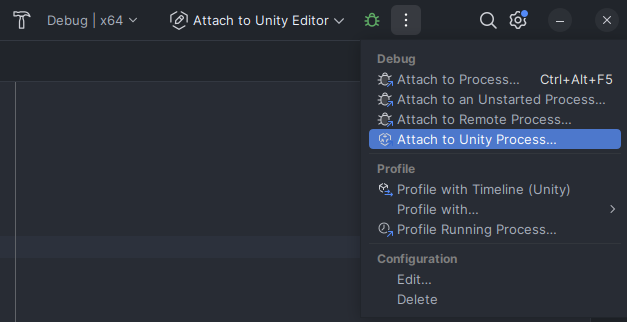
From now on, you can debug your mod at any time by choosing your saved connection from the
Attach to Unity Player button with the green play symbol in the top right of your IDE.
Note that you must start Subnautica first and then connect the debugger second. Start
setting breakpoints, explore your code in real time, and see what your variables are really doing.
Learn more about Visual Studio's debugger and what it can do in the official docs.